|
Clear and easy readable graphs
are an essential tool in interpreting large quantities of data.
Ekopower supplies several useful utilities for Excel in order
to carry out quick and easy dataprocessing of data collected
by the wind-meteo logger using
EKO21N or iBOX datalogger module.
Available software for data processing:

-
Wind-Grapher software for advanced use
- Basic wind utilities (running under Excel97)
- Dataprocessing
services available (eg calculation wind energy production)
The advanced user is
recommended to use both as some unique features
are available in that case.
The following basic wind
utilities are available:
-
Convert data to roundhours
Normally the data is logged with a 10 minute interval, synchronized
with real time clock. Meteo stations often record 1 hour average
values. To carry out correlation with data from meteo-stations,
the recorded 10 minute average values should be converted into
1 hour average values. By using the correlation and regression
technique the long term behaviour of the local wind speed can
be determined.
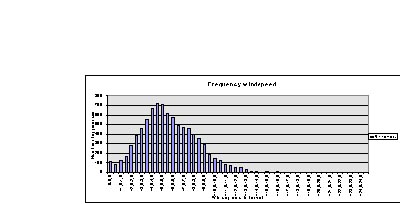
- Frequency distribution (graph
& table)
Refer to sample graph below: red measured at the top of the mast
and blue at a low level. The bin interval is selectable : 0.5
m/s or 1 m/s. Optional: calculation of the Weibull parameters
which discribes the distribution mathematically.
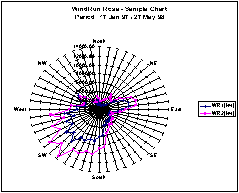
- Windrun rose (graph & table)
Distribution of measured windrun (=total distance covered by
the wind, like an odometer in a car). Refer to graph below.
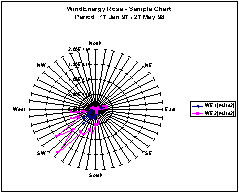
- Windenergy rose (graph & table)
Distribution of available windenergy.
|